A while back I wrote about the wiki that I set up for the television station that I work at. Using the mediawiki software I setup the wiki on an intranet webserver to handle our troubleshooting and technical guides as well as a directory of our equipment. We’ve made good progress over the two years we’ve been contributing to the wiki and I made a recent discovery that makes adding troubleshooting flow charts a breeze.
Graphviz is an open source graph visualization software that allows you to structure your data and display it in a number of ways. Their gallery shows the vast number of options that you can utilize to better show off your data.
I needed a way to add our troubleshooting flow charts when we have problems with our television transmitter. I also wanted to be able to have people click on a section of the flow chart to be taken to the wiki page with any extra details they would need for that step. Adding these links is a little harder with Graphviz but I was able to work around it.
The trick to adding links is to use a record shape in your graph. This lets you use HTML in the label for that node. It gets clunky, but here is the example of one node that is a link.
box1 [shape=record, label =<
<table border="0" cellpadding="0" cellspacing="0" TITLE="Main Transmitter">
  <tr>
    <td href="http://###.###.###.###/mediawiki/index.php/MRC_Site_2">Is the Main Transmitter On</td>
  </tr>
</table>>];
I found it interesting that you can’t create an anchor tag, instead you add an href property to your <td>. Graphviz has a ton of documentation for configuration and organizing structures. I’ve primarily been working with the dot framework but they also have options for a “spring model” layout, multiscale spring model, radial layouts, and circular layouts.
To use with the wiki I’m using the Graphviz mediawiki extension. To use the extension you add your code into a pair of <graphviz> tags and save the page. Unfortunately you have to save the page to see any changes, the preview option will not render a new image. Also if you have any errors in your code the image will not render and you’ll be left with a blank page. There is no feedback of what the problem is so you’ll have to scour the code to find it. The code inside the <graphviz> tag is run through the GraphViz program which compiles the code and outputs an PNG image (or other format that you choose). With the mediawiki extension the file is automatically uploaded to your wiki with a file name of the page name followed by digraph name-of-node and then the format of the graph, in my case dot. When you make a change the file name stays the same so you get a nice file history of all your changes.
After you name your graph you create all of the nodes and give them attributes, and then you define the connections between the nodes. Creating a node is a simple as giving it a name and ending the line with a semicolon. If you define a node before this the new one you create will have all of the same attributes as the node definition.
node [shape=circle; fillcolor="green";style="filled"];
greencircle_1; greencircle_2;
redcircle_1 [fillcolor="red"];
In this example I defined a node as a circle filled with green. I created two nodes which can be each on their own line, but I prefer to list them all next to each other for simplicity. Then I made a redcircle node, and only changed the fill color attribute. This node will take all of the previous attributes and then overrite the one that I specified.
This small example is similar to CSS classes, where a basic class has many attributes and a modifier class only changes a specific one or two to create a new style.
If I don’t add a label to an individual node or a node definition than the node will use its name as the text inside it. You can use escape characters in the label to create new lines as you’ll see in my example.
An example graph
Here is an example of the graph I created for our main troubleshooting flow chart when we lose our off air signal.
<graphviz>

digraph R {
node [shape=record; fontname=Ariel];
infobox [shape=square; label="This\neliminates\nSTL\nMicrowave\nProblem and\nEncoder\nSystem\nProblem"];
box1 [label =<
<table border="0" cellpadding="0" cellspacing="0" TITLE="Main Transmitter">
  <tr>
    <td href="http://###.###.###.###/mediawiki/index.php/MRC_Site_2">Is the Main Transmitter On</td></tr>
</table>>];
box2 [label="Switch Exciters"];
box3 [label="Problem Fixed?"];
box4 [label="Try to Turn Main Transmitter Back On"];
box5 [label="Problem Fixed?"];
box6 [label="Turn on Aux Transmitter"];
box7 [label="CALL ENGINEERING"];
node [shape=circle, fixedsize=true; width=0.9;label="yes";fillcolor="green";style="filled"];
yes1; yes2; yes3; yes4; yes5; yes6;
node [label="no";fillcolor="red"; style="filled"];
no1; no2; no3; no4;

box1->yes1;
box1->no1;
yes1->box2;
box2->yes2;
yes2->box3;
box3->yes3;
box3->no2;
no1->box4;
box4->yes4;
box4->no3;
yes4->box5;
box5->yes5;
no3->box6;
box6->yes6;
box6->no4;

yes3->box7;
yes5->box7;
yes6->box7;
no2->box7;
no4->box7;

labelloc="t";
label="No Over-The-Air Signal\nGUI Control Available";
fontsize="20";
}
</graphviz>
And this is the image that is generated.
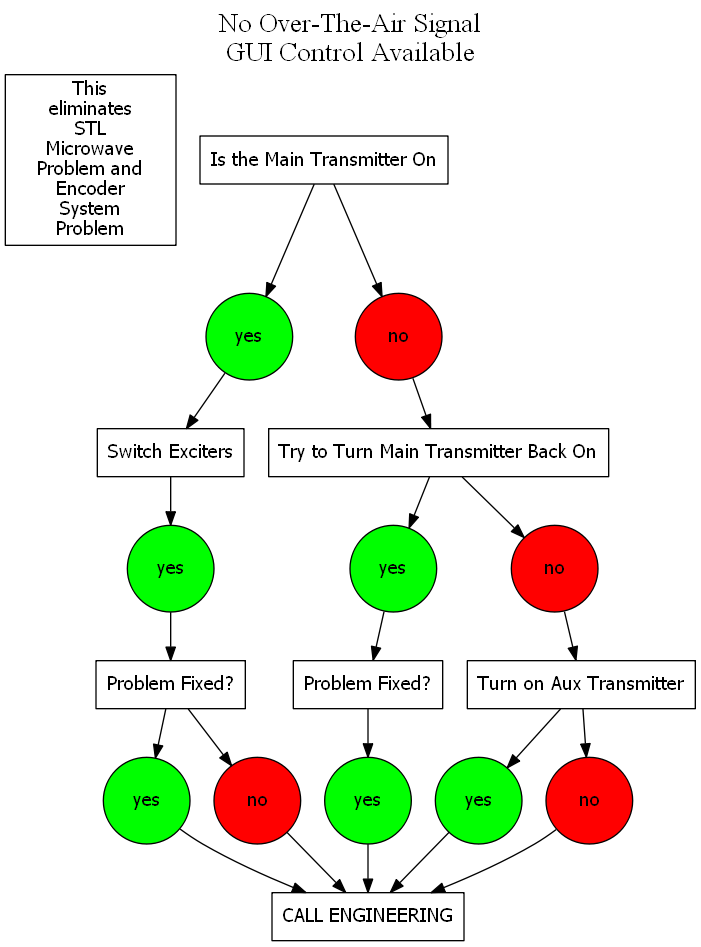
I’ll probably make improvements as we move on but this is a good start and an easy to follow flow chart for my staff at the station. Each box, aside from the Problem Fixed? ones, will be a link to a wiki page with the steps to perform the task listed. Either turning on the Auxiliary Transmitter or using the GUI to turn the transmitter back on.
I’ve only begun to scratch the surface of what GraphViz is capable of. I’m not sure if we’ll need all the bells and whistles for our wiki, but I’ll continue to learn as many features and make use of them as best I can.